get https://www.virustotal.com/api/v3/monitor/statistics
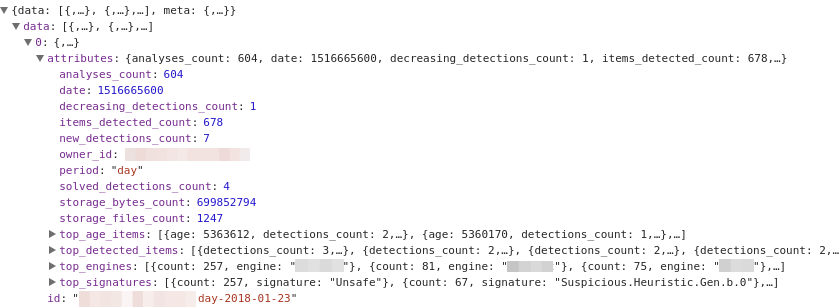
This endpoint returns information about your stored files, including quota consumption, detected files, top signatures, offending engines and oldest detections pending remediation.
A dictionary with data and meta properties is received, each data attributes will reflect past days statistics and meta realtime will reflect current detection counts. Data attributes also contains information about last day consumed storage (for realtime quota consumption user data should be check /ui/signin).

{"data": [
 {
  "attributes": {
  "date": 1517270400,
  "items_detected_count": 28,
  "increasing_detections_count": 6,
  "owner_id": "monitor_group",
  "period": "day",
  "storage_bytes_count": 166709820,
  "storage_files_count": 34,
  "top_age_items": [
   {
   "age": 7621121,
   "detections_count": 46,
   "monitor_key": "[MONITOR-ID]",
   "total_engines_count": 71
   }...
  ],
  "top_detected_items": [
   {
   "detections_count": 47,
   "monitor_key": "[MONITOR-ID]",
   "total_engines_count": 71
   }...
  ],
  "top_engines": [
   {
   "count": 20,
   "engine": "[ENGINE-NAME]"
   }...
  ],
  "top_signatures": [
   {
   "count": 20,
   "signature": "Unsafe"
   }...
  ]
  },
  "id": "monitor_group-day-2018-01-30",
  "type": "monitor_statistics"
 }...
 ],
 "meta": {
 "realtime": {
  "decreasing_detections_count": 0,
  "increasing_detections_count": 6,
  "items_detected_count": 28,
  "new_detections_count": 0,
  "solved_detections_count": 0,
  "swapped_detections_count": 0
 }
 }
}
