
Introduction
VirusTotal Graph is a visualization tool built on top of VirusTotal data set. It understands the relationship between files, URLs, domains, IP addresses and other items encountered in an ongoing investigation. With it, you can pivot intelligently over any of the malware artifacts in your graph and synthesize your findings into a threat map that you can share with your colleagues.
VirusTotal Graph Overview
VirusTotal Graph search and start new investigation
VirusTotal Graph management
VirusTotal Graph nodes
VirusTotal Graph Commonalities and Hunting
Quick access to relevant graphs to you
Toolbar
VirusTotal Graph API
Quick access to relevant graphs to you
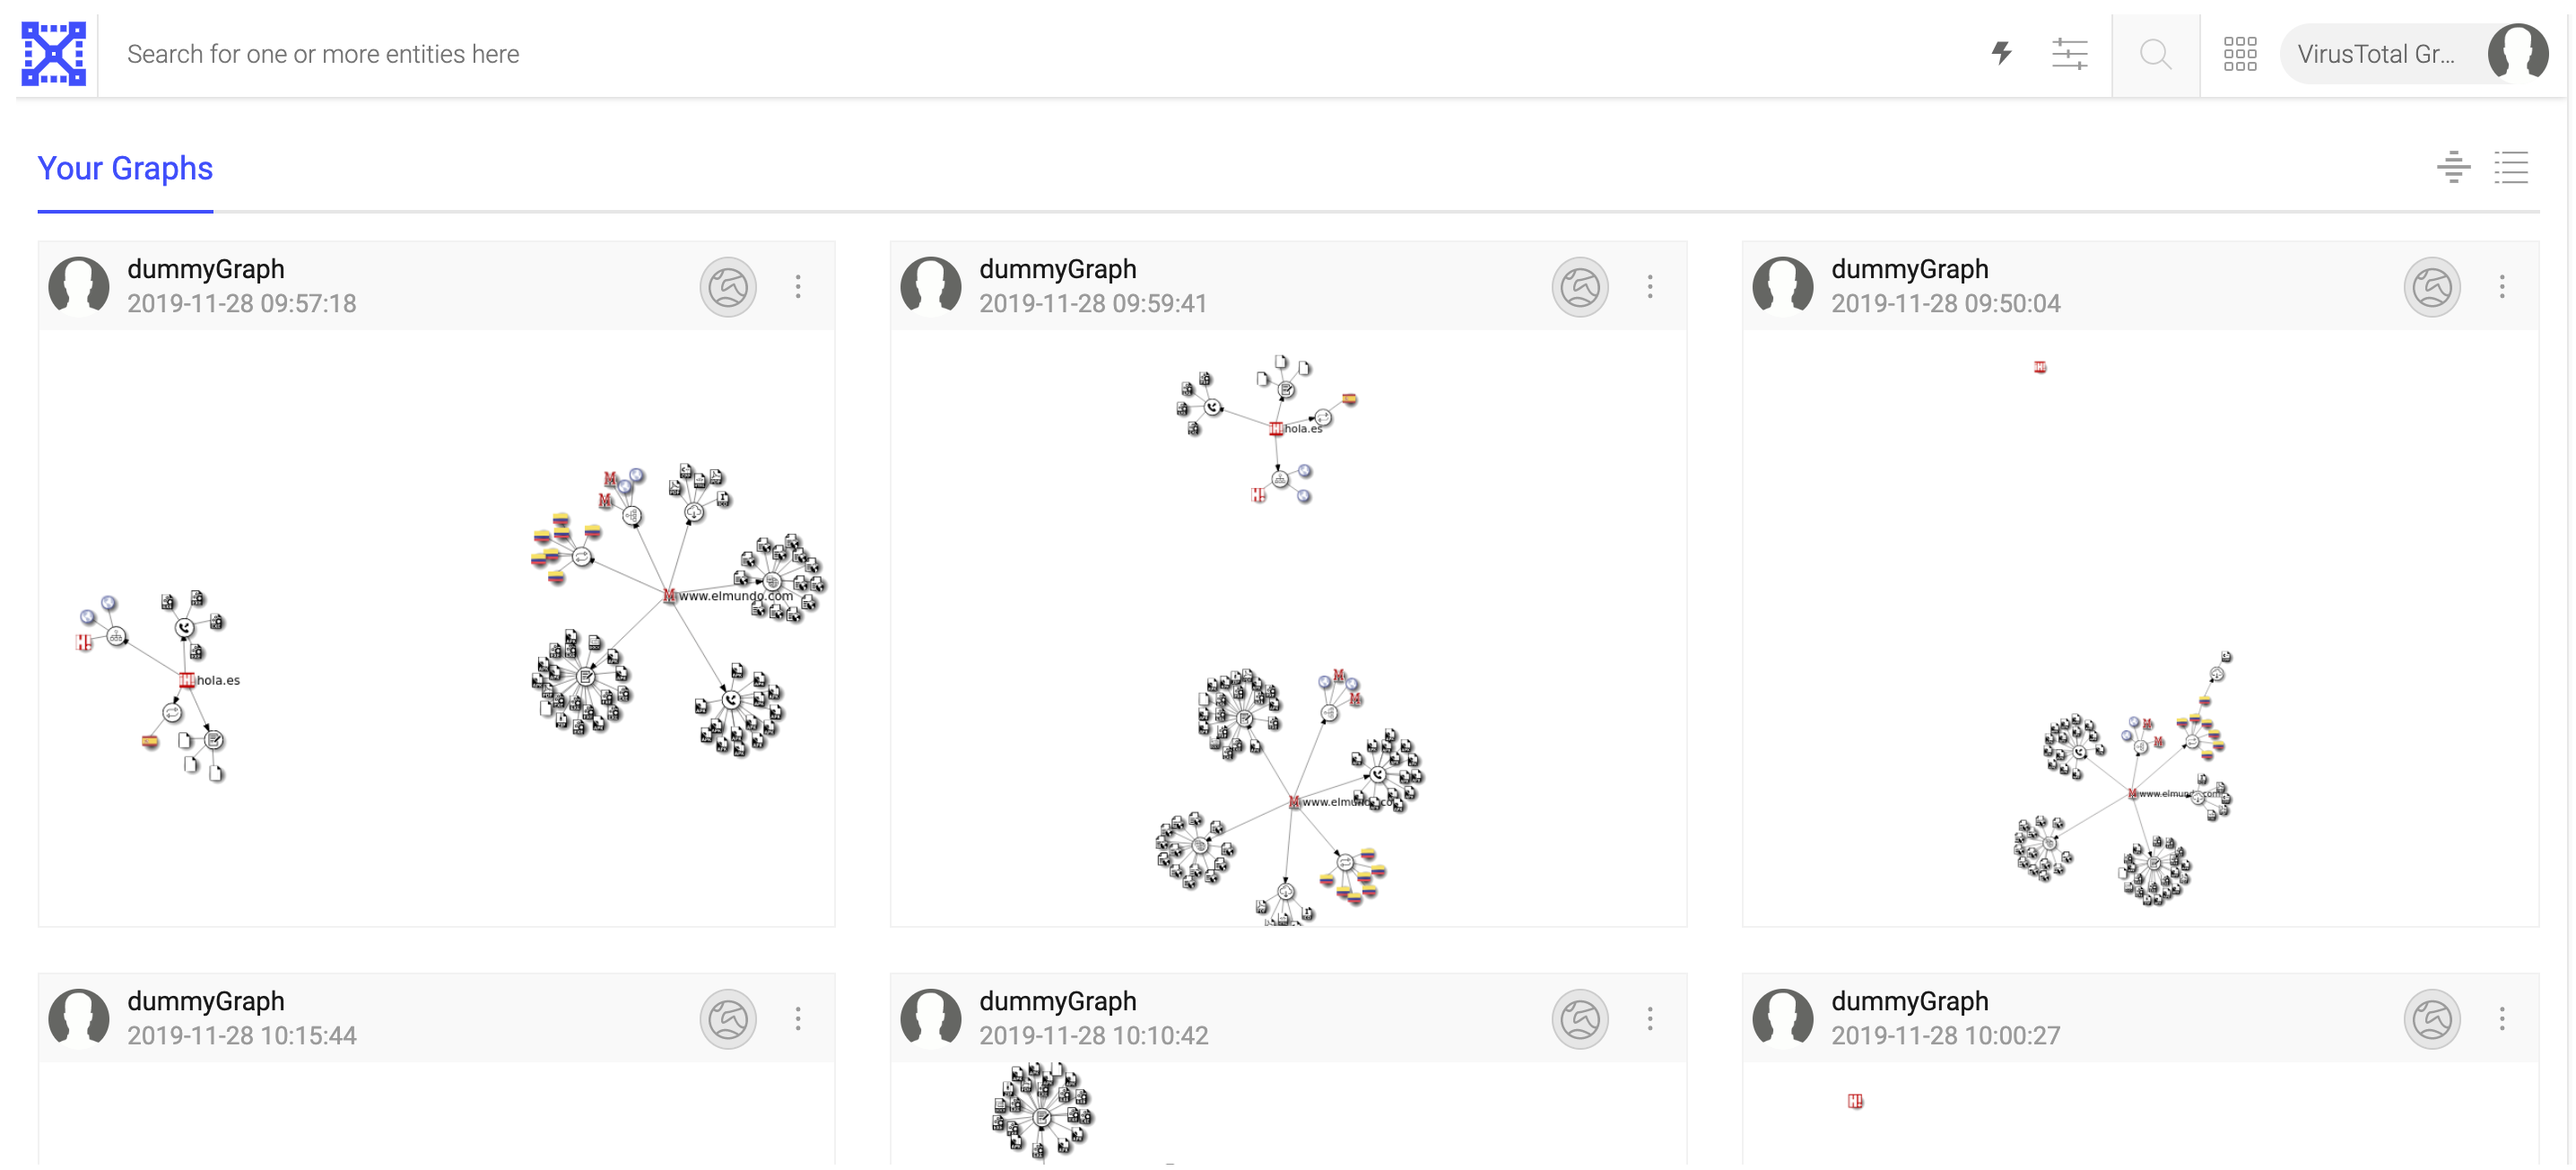
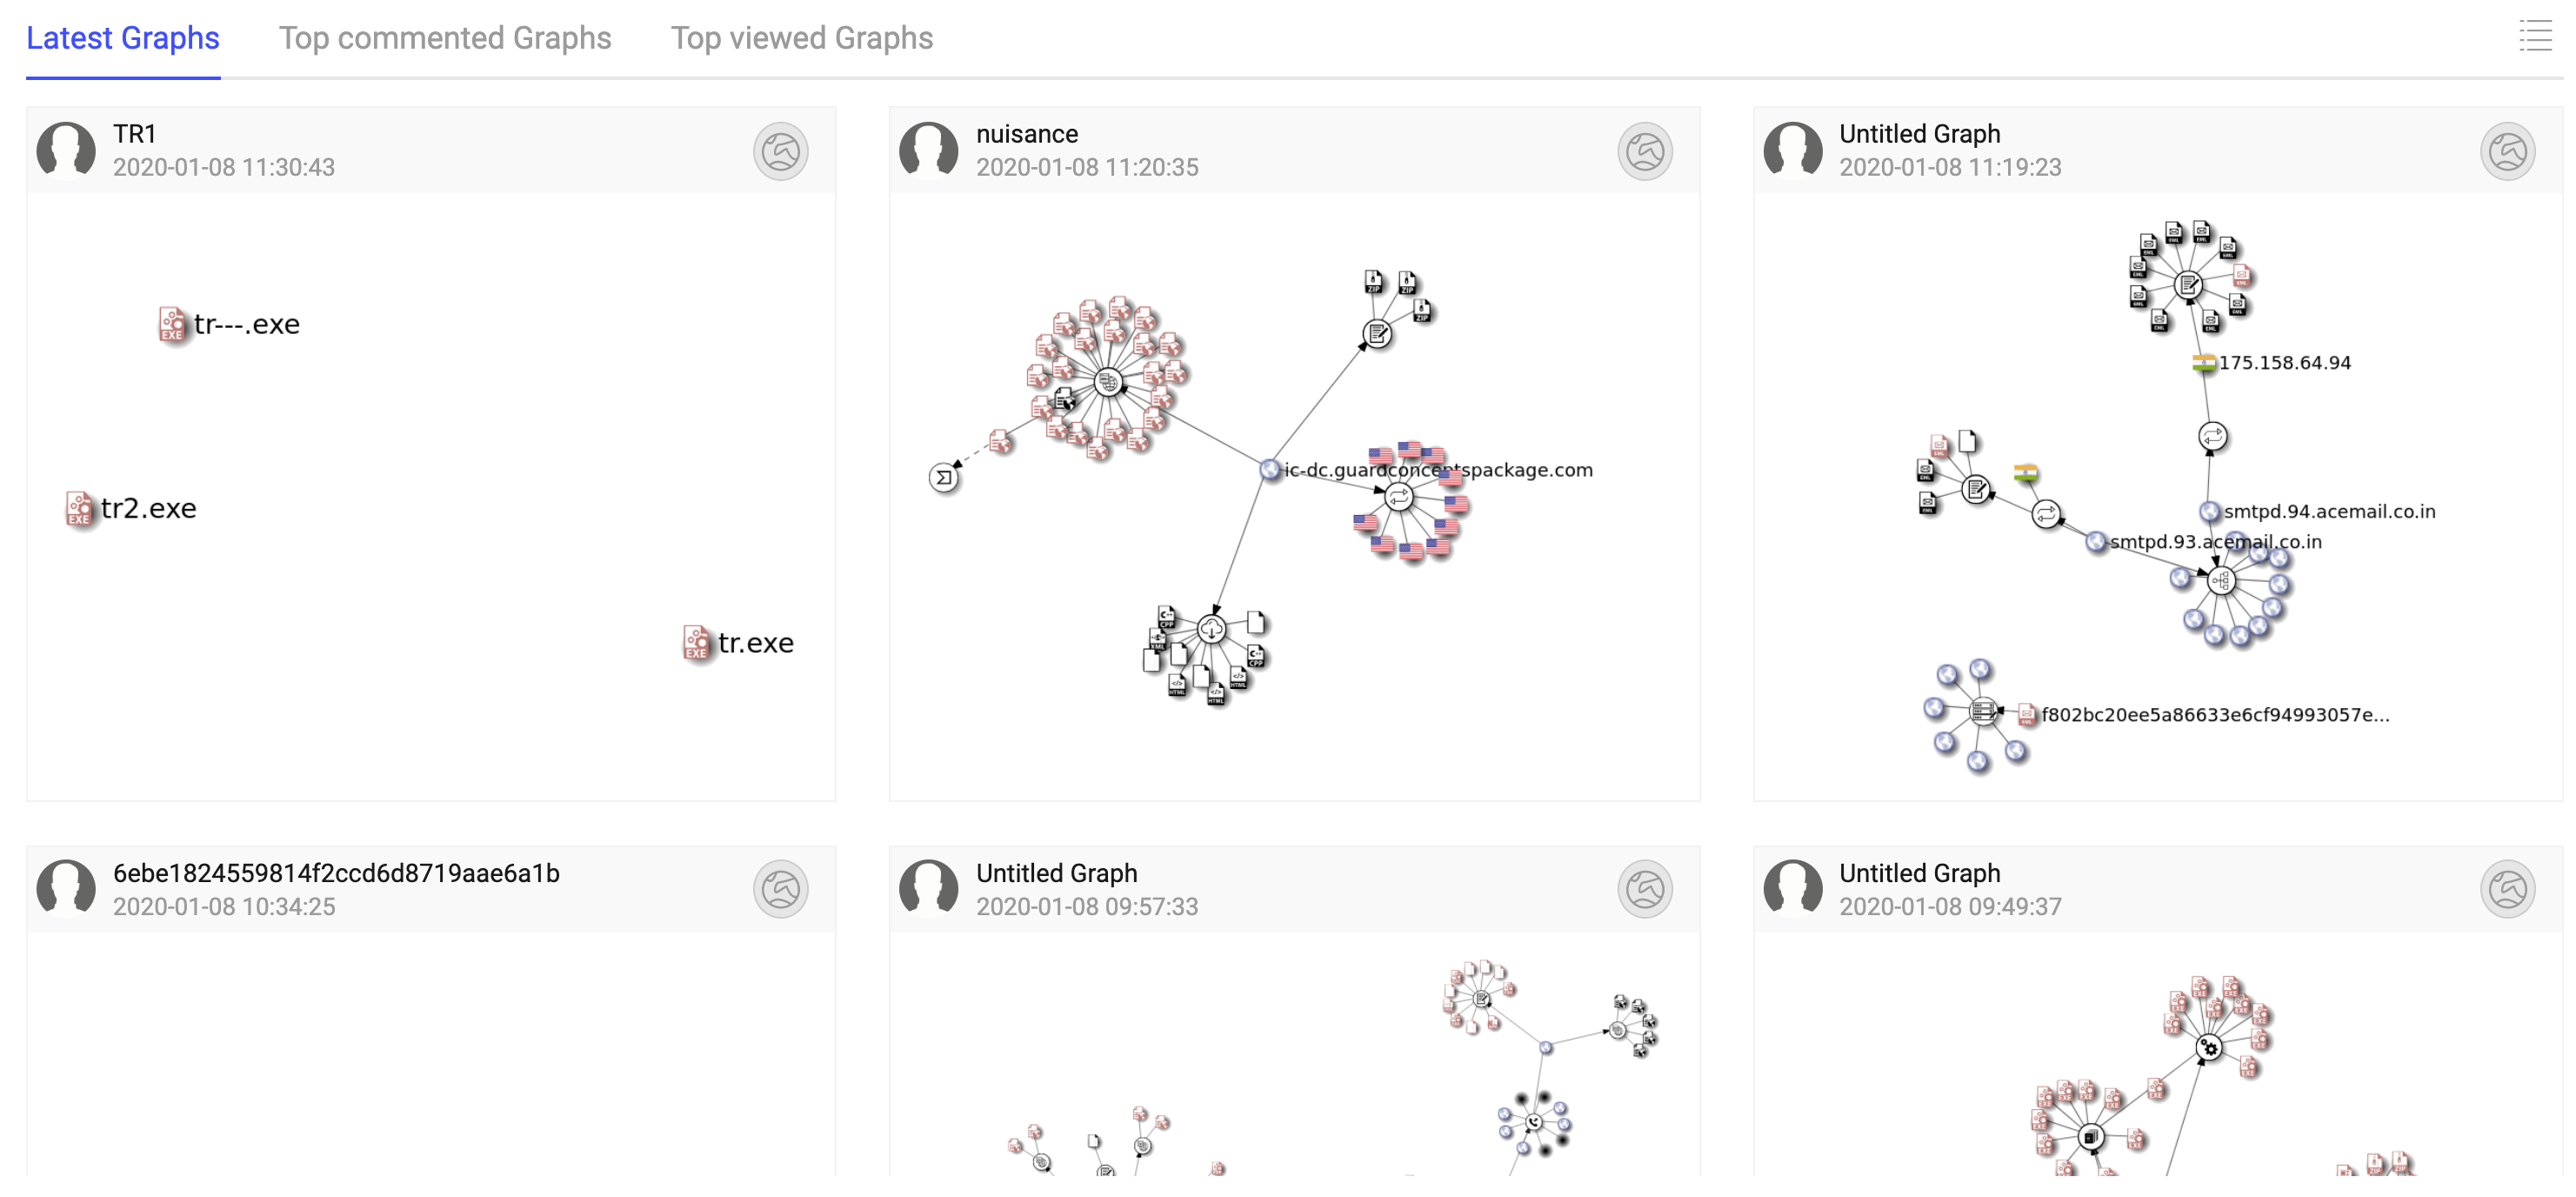
This overview page shows different list of graphs:
- Your graphs: It includes your saved graphs and those graphs where you are editor or viewer
- Latest graphs: It includes the latest created graphs
- Top commented graphs: It includes the graphs that have more comments
- Top viewed graphs: It includes the graphs more visited
Toolbar
For any of the list of graphs you are able to
 : Sort by different criteria
 /
/ : Switch between list and grid views
VirusTotal Graph API
As most of our other products, VirusTotal Graph is getting a restful API. The documentation can be found here and a Python library to reduce the learning curve; it is available in our Github repository.
Updated 5 months ago